CHEYENNE– Results for the first administration of the Wyoming Test of Proficiency and Progress (WY-TOPP) are now available online.
“WY-TOPP was a major shift and improvement for our schools,” said State Superintendent Jillian Balow. “We went from a paper and pencil, multiple-choice-only test that provided limited useful information to teachers, to an adaptable, interactive, online assessment that gives teachers data that can be used to inform instruction.”
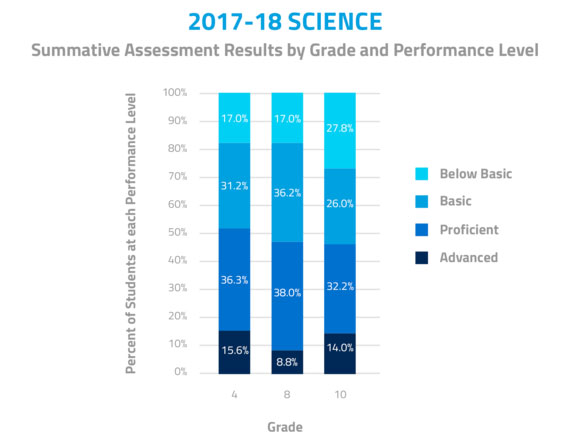
Statewide WY-TOPP Results
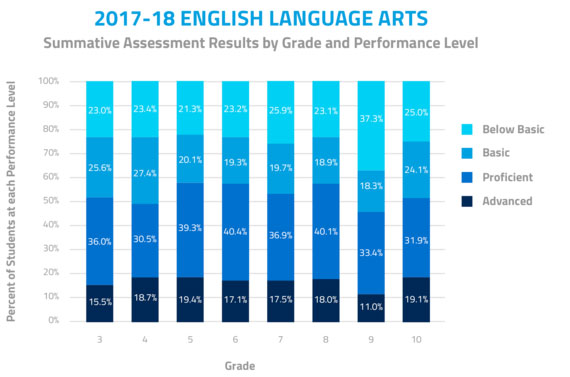
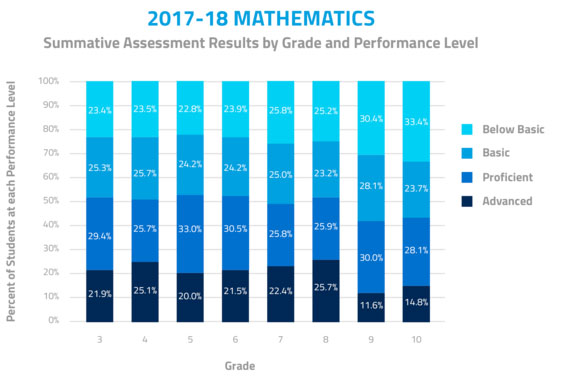
The new assessment system was implemented in the 2017-18 school year, with students in grades 3-10 taking the WY-TOPP summative assessments for math and English language arts (ELA) through an adaptive online platform.
Grade 4, 8, and 10 students were assessed in science through a fixed-form online assessment. Students in grades 3, 5, 7, and 9 were also assessed in writing.
Sweetwater County School District #1 WY-TOPP Results
Grade 3: 440-449 students tested
- Math- 99.8% participation
- Below Basic/Basic: 42.12%
- Proficient/Advanced: 57.88%
- ELA- 99.8% participation
- Below Basic/Basic: 48.53%
- Proficient/Advanced: 51.47%
Grade 4: 440-449 students tested
- Math- 99.8% participation
- Below Basic/Basic: 50%
- Proficient/Advanced: 50%
- ELA- 100% participation
- Below Basic/Basic: 56.35%
- Proficient/Advanced: 43.65%
- Science- 99.6% participation
- Below Basic/Basic: 53.91%
- Proficient/Advanced: 46.09%
Grade 5: 450-459 students tested
- Math- 99.8% participation
- Below Basic/Basic: 59.87%
- Proficient/Advanced: 40.13%
- ELA- 99.8% participation
- Below Basic/Basic: 47.37%
- Proficient/Advanced: 52.63%
Grade 6: 460-469 students tested
- Math- 99.4% participation
- Below Basic/Basic: 52.68%
- Proficient/Advanced: 47.32%
- ELA- 99.1% participation
- Below Basic/Basic: 42.92%
- Proficient/Advanced: 57.08%
Grade 7: 430-439 students tested
- Math- 99.5% participation
- Below Basic/Basic: 51.15%
- Proficient/Advanced: 48.85%
- ELA- 99.3% participation
- Below Basic/Basic: 36.34%
- Proficient/Advanced: 63.66%
Grade 8: 380-389 students tested
- Math- 99.2% participation
- Below Basic/Basic: 40.57%
- Proficient/Advanced: 59.43%
- ELA- 98.5% participation
- Below Basic/Basic: 37.5%
- Proficient/Advanced: 62.5%
- Science- 98.7% participation
- Below Basic/Basic: 46.49%
- Proficient/Advanced: 53.51%
Grade 9: 420-429 students tested
- Math- 98.1% participation
- Below Basic/Basic: 64.76%
- Proficient/Advanced: 35.24%
- ELA- 98.4% participation
- Below Basic/Basic: 61.76%
- Proficient/Advanced: 38.24%
Grade 10: 350-359 students tested (340-349 students tested for science)
- Math- 98% participation
- Below Basic/Basic: 62%
- Proficient/Advanced: 38%
- ELA- 98.3% participation
- Below Basic/Basic: 54.7%
- Proficient/Advanced: 45.3%
- Science- 96.9% participation
- Below Basic/Basic: 55.49%
- Proficient/Advanced: 44.51%
Sweetwater County School District #2 WY-TOPP Results
Grade 3: 230-239 students tested
- Math- 100% participation
- Below Basic/Basic: 41.87%
- Proficient/Advanced: 58.62%
- ELA- 100% participation
- Below Basic/Basic: 41.81%
- Proficient/Advanced: 58.19%
Grade 4: 210-219 students tested
- Math- 100% participation
- Below Basic/Basic: 32.11%
- Proficient/Advanced: 67.89%
- ELA- 100% participation
- Below Basic/Basic: 38.53%
- Proficient/Advanced: 61.47%
- Science- 100% participation
- Below Basic/Basic: 33.49%
- Proficient/Advanced: 66.51%
Grade 5: 210-219 students tested
- Math- 100% participation
- Below Basic/Basic: 43.6%
- Proficient/Advanced: 56.4%
- ELA- 100% participation
- Below Basic/Basic: 45.71%
- Proficient/Advanced: 54.29%
Grade 6: 180-189 students tested
- Math- 100% participation
- Below Basic/Basic: 38.67%
- Proficient/Advanced: 61.33%
- ELA- 100% participation
- Below Basic/Basic: 37.02%
- Proficient/Advanced: 62.98%
Grade 7: 190-199 students tested
- Math- 100% participation
- Below Basic/Basic: 36.73%
- Proficient/Advanced: 63.27%
- ELA- 100% participation
- Below Basic/Basic: 47.96%
- Proficient/Advanced: 52.04%
Grade 8: 170-179 students tested
- Math- 99.4% participation
- Below Basic/Basic: 39.11%
- Proficient/Advanced: 60.89%
- ELA- 99.4% participation
- Below Basic/Basic: 36.52%
- Proficient/Advanced: 63.48%
- Science- 98.9% participation
- Below Basic/Basic: 60.67%
- Proficient/Advanced: 39.33%
Grade 9: 200-209 students tested
- Math- 99.5% participation
- Below Basic/Basic: 58.74%
- Proficient/Advanced: 41.26%
- ELA- 99.5% participation
- Below Basic/Basic: 50.49%
- Proficient/Advanced: 49.51%
Grade 10: 200-209 students tested
- Math- 99% participation
- Below Basic/Basic: 61.17%
- Proficient/Advanced: 38.83%
- ELA- 99% participation
- Below Basic/Basic: 46.12%
- Proficient/Advanced: 53.88%
- Science- 98.6% participation
- Below Basic/Basic: 57.07%
- Proficient/Advanced: 42.93%
Spending Less Money and Taking Up Less Time in the Classroom
“I’m so proud of the teachers, principals, tech directors, and assessment coordinators who helped make this transition as seamless as it could be for students. Now, not only are we spending less money on the statewide assessment, it’s also taking up less time in the classroom while providing a better measure of student performance,” Balow said.
Keith Kline, principal at Etna Elementary School in Lincoln County School District #2 said WY-TOPP is the easiest assessment to use and the most helpful when assessing student performance.
Kline also said that the teachers at Etna Elementary are able to look at the data from WY-TOPP and discuss what is working in one classroom that could be implemented in another classroom.
New Baseline for Statewide Assessment Results
The 2018 WY-TOPP results represent a new baseline for statewide assessment results. Proficiency rates from WY-TOPP will not be comparable to proficiency rates from the Proficiency Assessment for Wyoming Students (PAWS), as the two assessments are so different.
Educators can compare their school’s WY-TOPP results to the state average to determine how the students are progressing.
The WY-TOPP results will be used to inform accountability determinations, which will be released on November 1, 2018.